Operations
Initially established by Glencore plc to address a quicklime shortage in Zambia, Limeco has seen over $100 million invested in the development of the mine and processing plant.
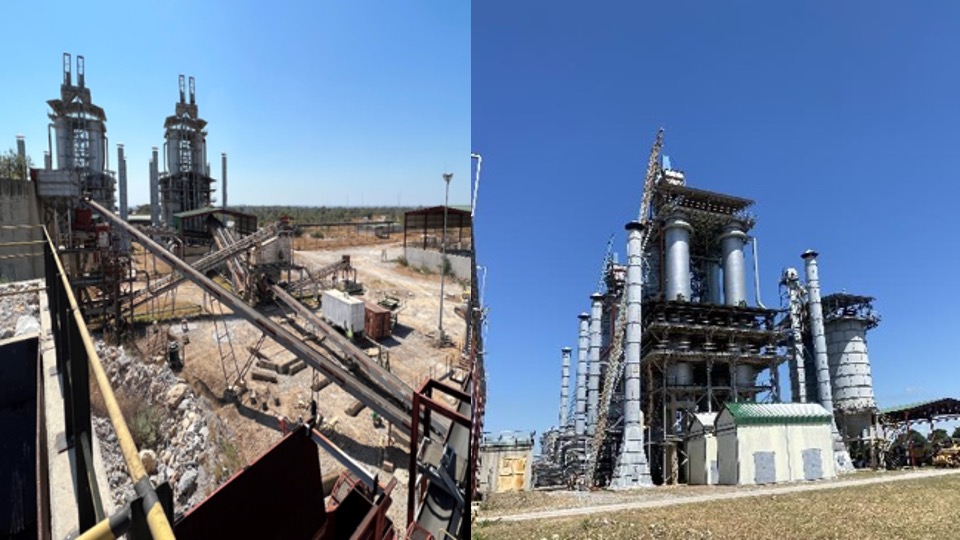
The project boasts a high-quality Tier 1 limestone deposit, forming the cornerstone of Limeco’s robust quicklime business, alongside a state-of-the-art lime plant, which includes:
• A two-stage crushing circuit with an installed primary throughput capacity of 300 tonnes per hour (tph) of limestone comprising a jaw and an impact crusher, followed by two sets of screens - a double and triple deck.
• Eight vertical kilns for burning the crushed limestone (the +60 mm to -90 mm fraction separated by the double deck screen) to produce between 600 to 800 tonnes of quicklime per day. The -60 mm stream from the crushing circuit is passed through the triple deck screen to split it into three aggregate size fractions.
The project also has an on-site laboratory to test calcium carbonate (CaCO3) and quicklime (CaO) content to meet the specifications of potential offtakers. To date, testwork has produced CaO results between 92% and 94%, aligning with target specifications.
This is a zero-waste project, with all waste streams being repurposed for ancillary products and services, such as aggregate production, underscoring Limeco’s commitment to sustainable practices.
Ancillary Revenue Streams
Ancillary products and services contribute positively to the project’s cash flow. These include aggregate production, which, as of January 2025, reached nameplate capacity of 350,000 tonnes per annum, with the product being sold to local industrial companies.
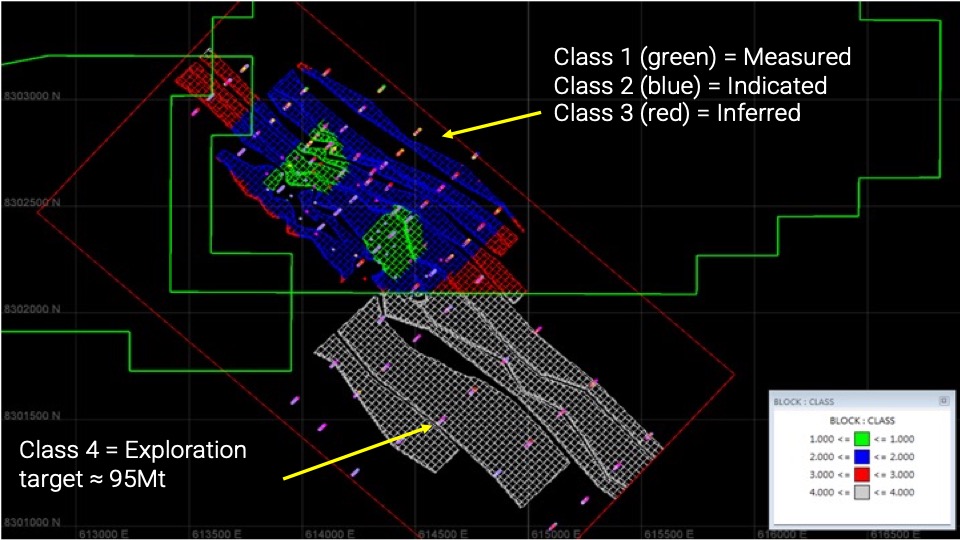
Maiden JORC Compliant MRE
Limeco’s project has a JORC-compliant MRE of 145.2Mt at 95.7% CaCO3, consisting of 11.8Mt in the Measured category, 55.4Mt in the Indicated category, and 78.0Mt in the Inferred category (November 2024). This resource supports over 50 years of potential quicklime production. The focus of the November 2024 MRE was on Domain A, but Domains B and C offer significant opportunities to unlock additional value and provide the flexibility to scale according to demand.
The gross Mineral Resource for Domain A is 145.2 Mt comprising 11.8 Mt in Measured, 55.4Mt in Indicated and 78.0Mt in Inferred (Table 1).
Table 1: Domain A gross Mineral Resource for Limeco Resources (Earthlab, November 2024)
| Category |
Tonnes |
CaO (%) |
CaCO3 (%) |
MgO (%) |
Fe2O2 (%) |
Al2O2 (%) |
SiO2 (%) |
LO (%) |
| Measured | 11.8 | 53.7 | 95.8 | 1.2 | 0.1 | 0.2 | 0.6 | 42.8 |
| Indicated | 55.4 | 53.5 | 95.5 | 1.2 | 0.2 | 0.2 | 0.8 | 42.6 |
| Measured + Indicated | 67.2 | 53.5 | 95.6 | 1.2 | 0.2 | 0.2 | 0.8 | 42.7 |
| Inferred | 78.0 | 53.6 | 95.7 | 1.5 | 0.2 | 0.4 | 0.9 | 42.1 |
| Total | 145.2 | 53.6 | 95.7 | 1.4 | 0.2 | 0.3 | 0.8 |
42.4 |
Total gross potential saleable quicklime for Domain A is 31.9Mt comprising 2.6Mt in Measured, 12.1Mt in Indicated and 17.2Mt in Inferred (Table 2).
Table 2: Domain A gross potential saleable quicklime for Limeco Resources (Earthlab, November 2024)
| Category |
Tonnes |
CaO (%) |
MgO (%) |
Fe2O2 (%) |
Al2O2 (%) |
SiO2 (%) |
| Measured | 12.6 | 96.3 | 2.1 | 0.2 | 0.3 | 1.1 |
| Indicated | 12.1 | 95.6 | 2.2 | 0.3 | 0.4 | 1.4 |
| Measured + Indicated | 14.7 | 95.8 | 2.2 | 0.3 | 0.4 | 1.4 |
| Inferred | 17.2 | 94.6 | 2.7 | 0.4 | 0.8 | 1.5 |
| Total | 31.9 | 95.1 | 2.5 | 0.3 | 0.6 | 1.5 |
Total gross potential saleable aggregate for Domain A is 87.1Mt comprising 7.1Mt in Measured, 33.2Mt in Indicated and 46.8Mt in Inferred (Table 3).
Table 3: Domain A gross potential saleable aggregate for Limeco Resources (Earthlab, November 2024)
| Category |
Tonnes |
CaO (%) |
CaCO3 (%) |
MgO (%) |
Fe2O2 (%) |
Al2O2 (%) |
SiO2 (%) |
LO (%) |
| Measured | 7.1 | 53.7 | 95.8 | 1.2 | 0.1 | 0.2 | 0.6 | 42.8 |
| Indicated | 33.2 | 53.5 | 95.5 | 1.2 | 0.2 | 0.2 | 0.8 | 42.6 |
| Measured + Indicated | 40.3 | 53.5 | 95.6 | 1.2 | 0.2 | 0.2 | 0.8 | 42.7 |
| Inferred | 46.8 | 53.6 | 95.7 | 1.5 | 0.2 | 0.4 | 0.9 | 42.1 |
| Total | 87.1 | 53.6 | 95.7 | 1.4 | 0.2 | 0.3 | 0.8 |
42.4 |